Final presentations of CoastScan Bachelor Students

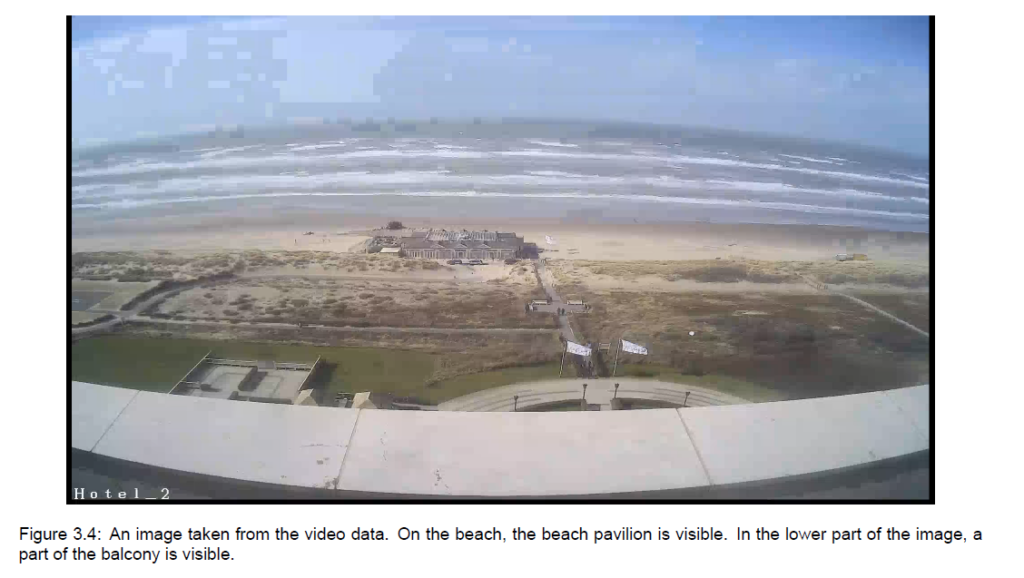
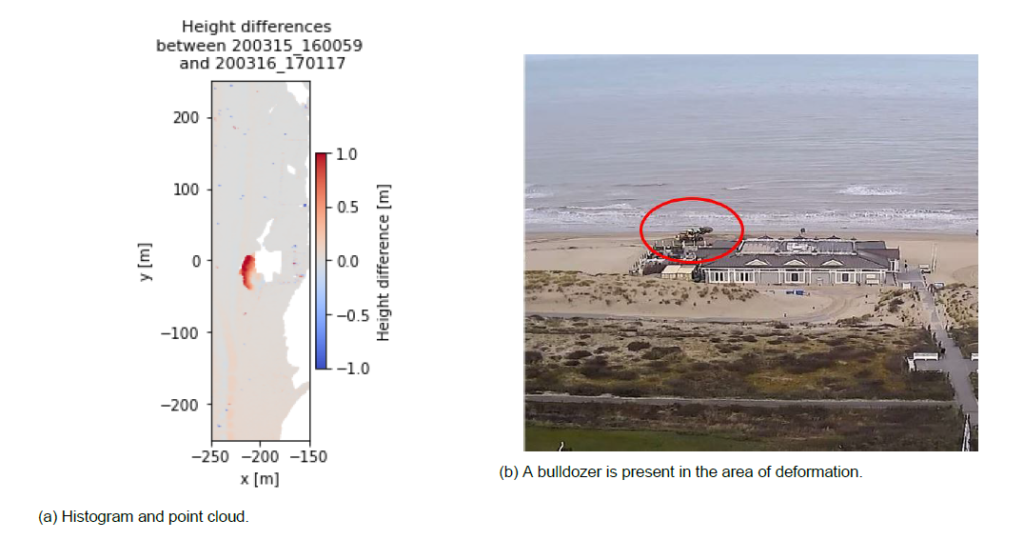
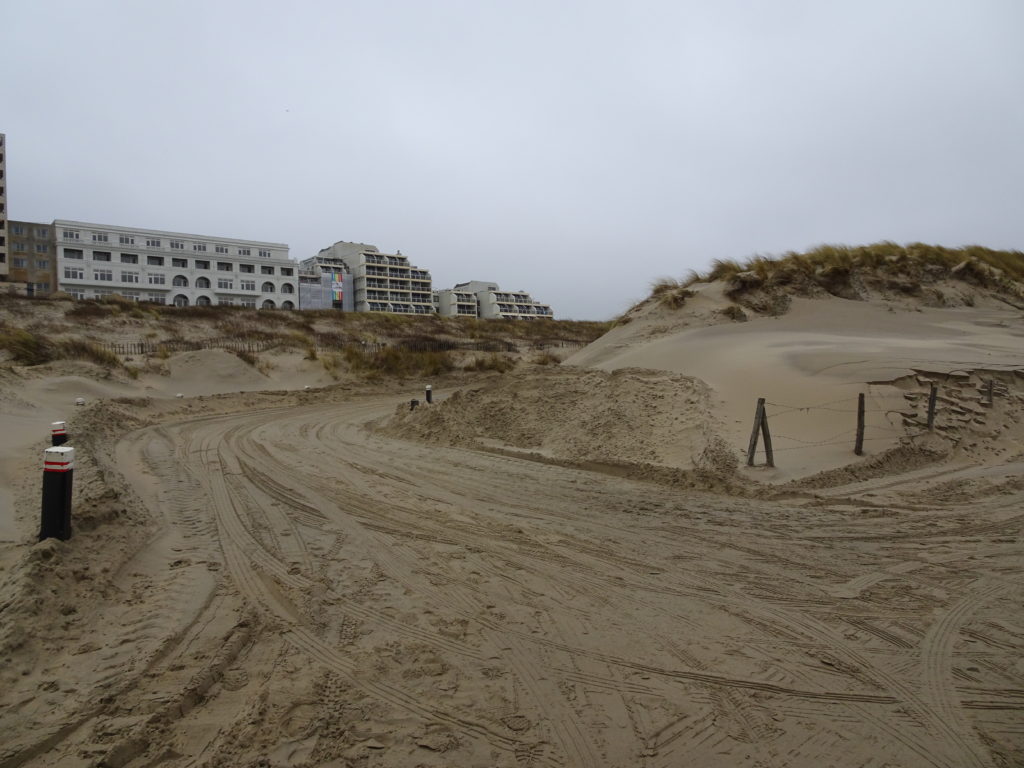
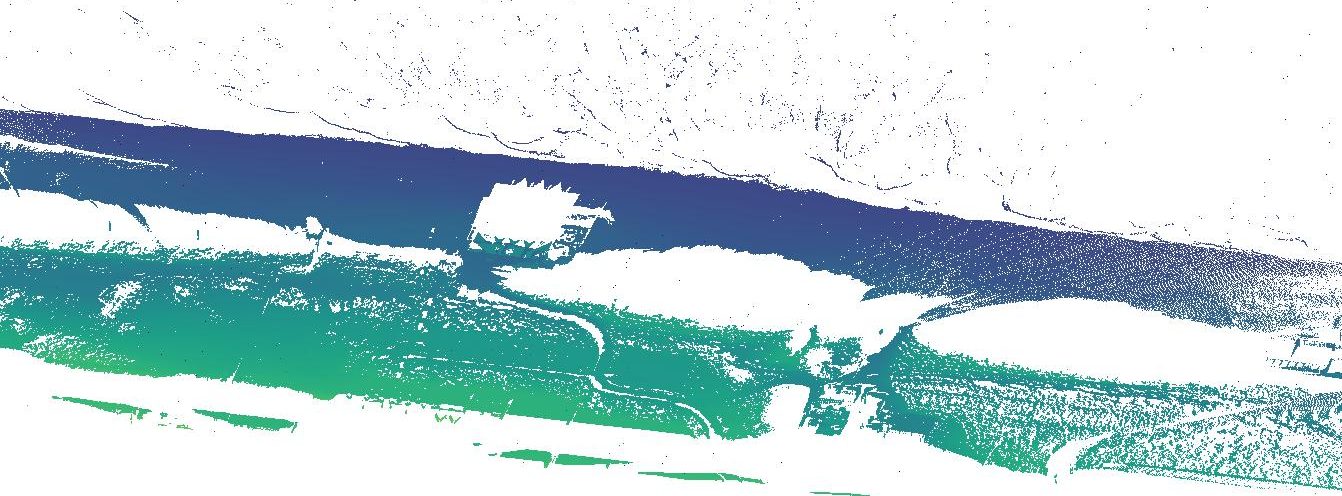
D.A.J. van Dieren: Anthropogenic beach deformations – Characterizing anthropogenic beach changes using laser scan and video data
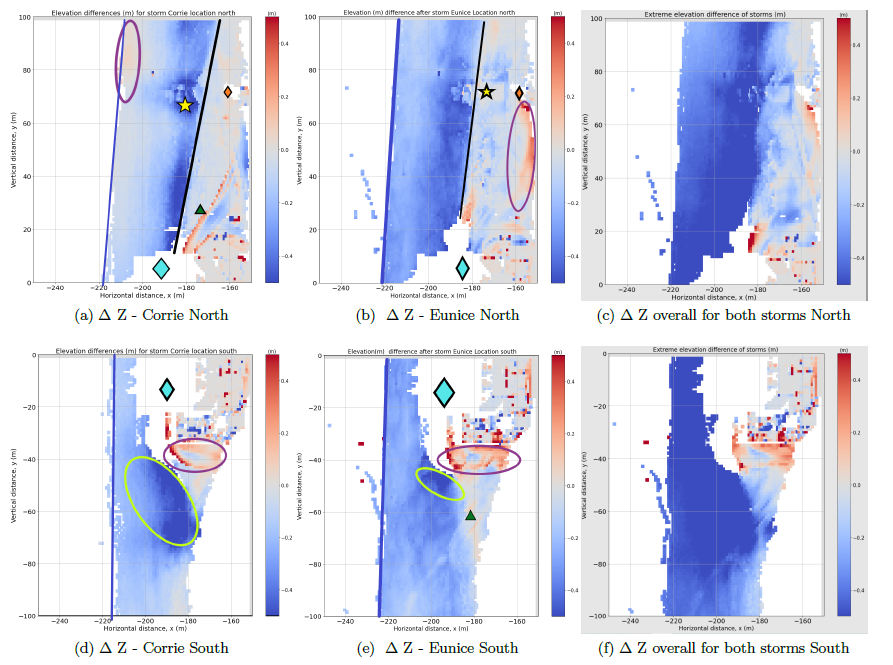
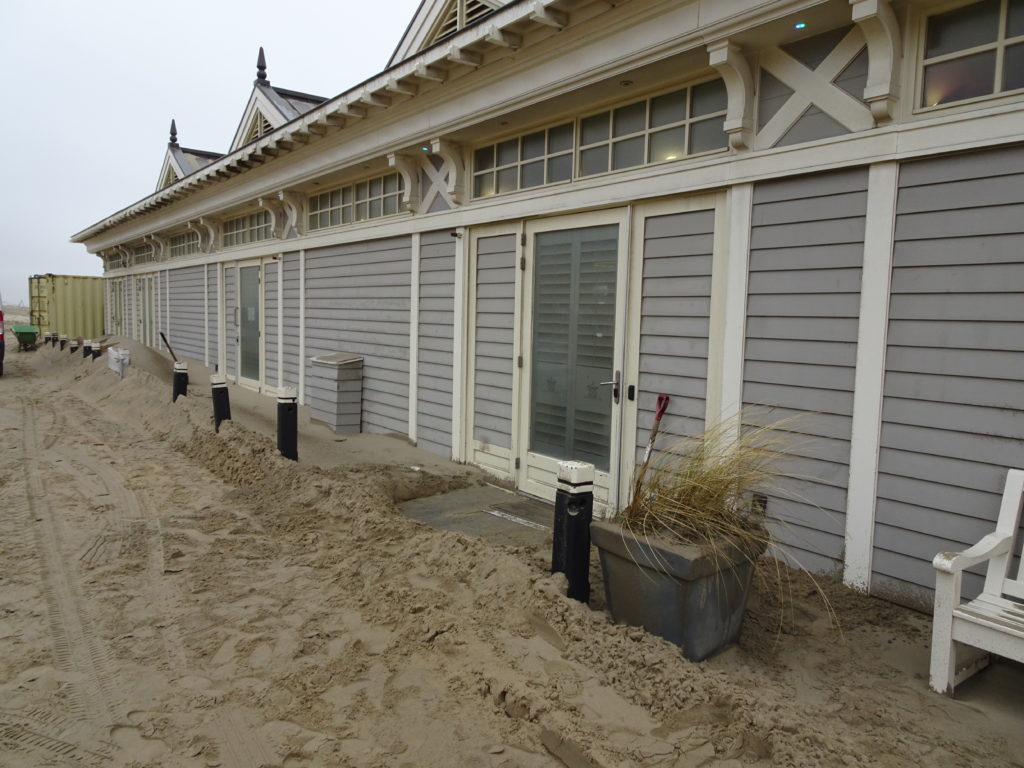
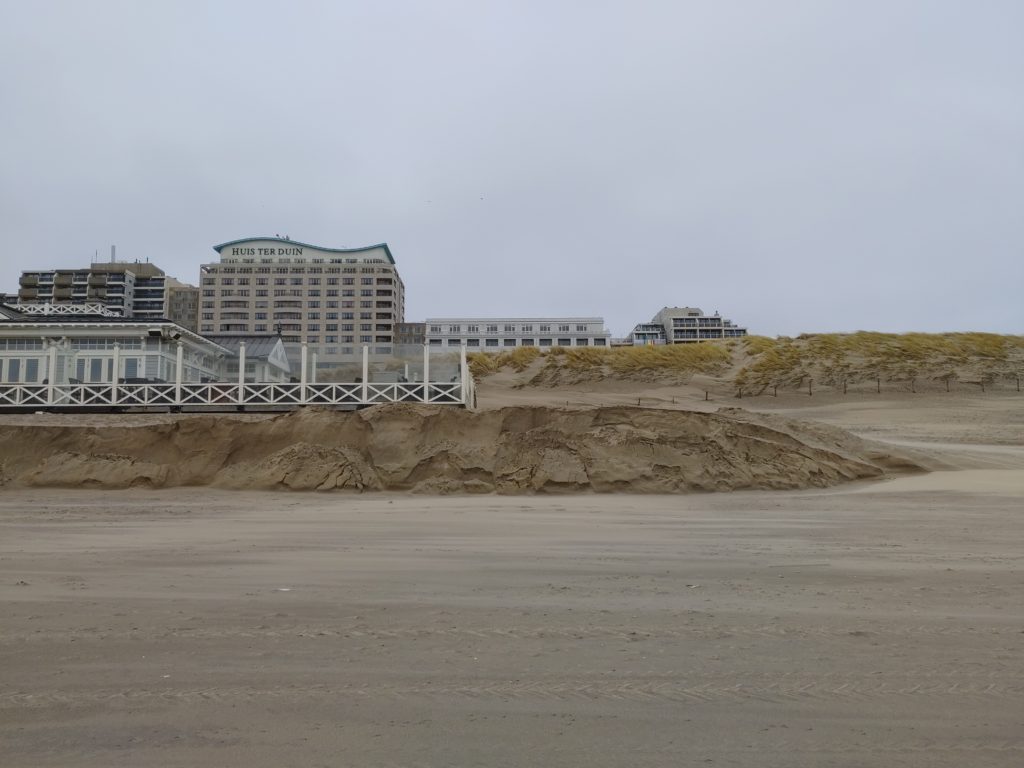
D. Madi: Comparing the effects of winter storms Corrie and Eunice on Noordwijk using laser data
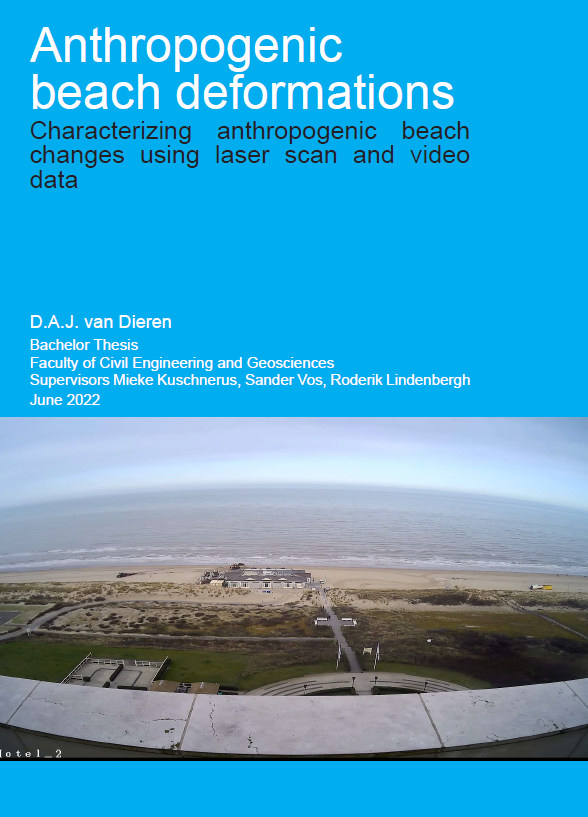
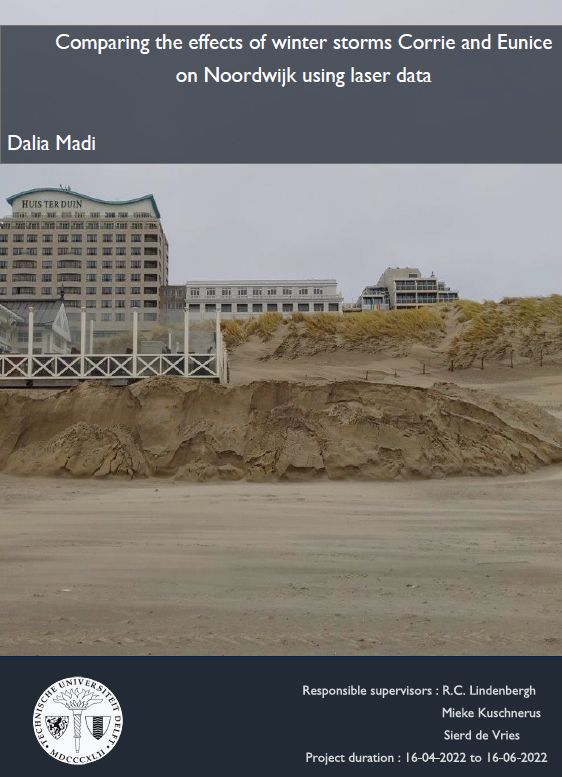
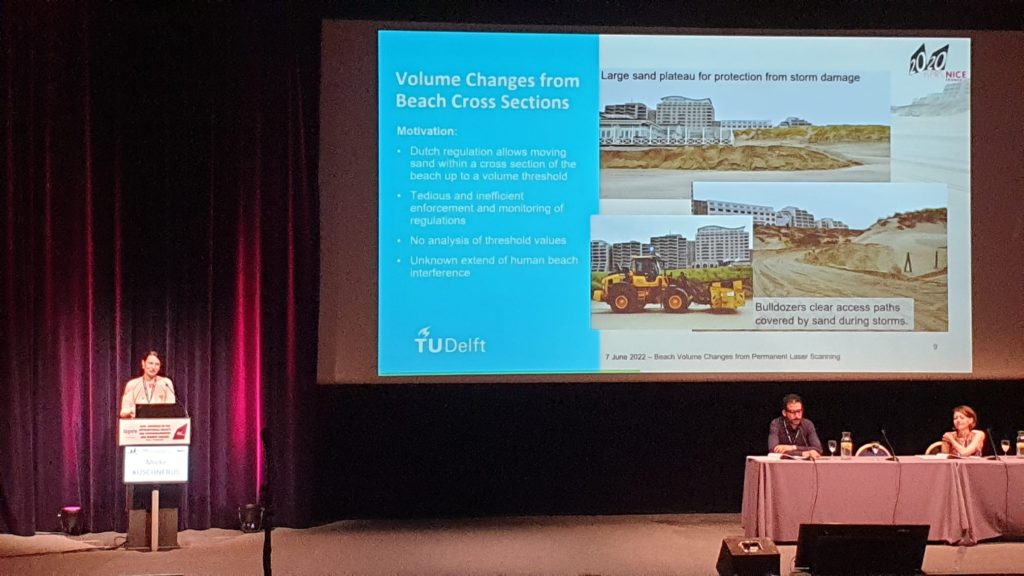
Debora van Dieren and Dalia Madia have successfully completed their final Bachelor projects and presented their results on June 16th. They used our CoastScan data set to quantify storm damages (Dalia) and detect anthropogenic activities (Debora). Congratulations to both!

New data publication with nature article

Today our article “A high-resolution 4D terrestrial laser scan dataset of the Kijkduin beach-dune system, The Netherlands,” (https://doi.org/10.1038/s41597-022-01291-9) by S. Vos, K. Anders, M. Kuschnerus, R. Lindenbergh, B. Höfle, S. Aarninkhof, S. de Vries was published in the nature scientific data journal.

The article explains our latest data publication (https://doi.org/10.1594/PANGAEA.934058) on the PANGAEA repository for earth and environmental science data. All point clouds collected at the CoastScan location in Kijkduin during a six months observation period from November 2016 to May 2017 can be found here.

Three new student projects about 3D surveying of the coast in Noordwijk

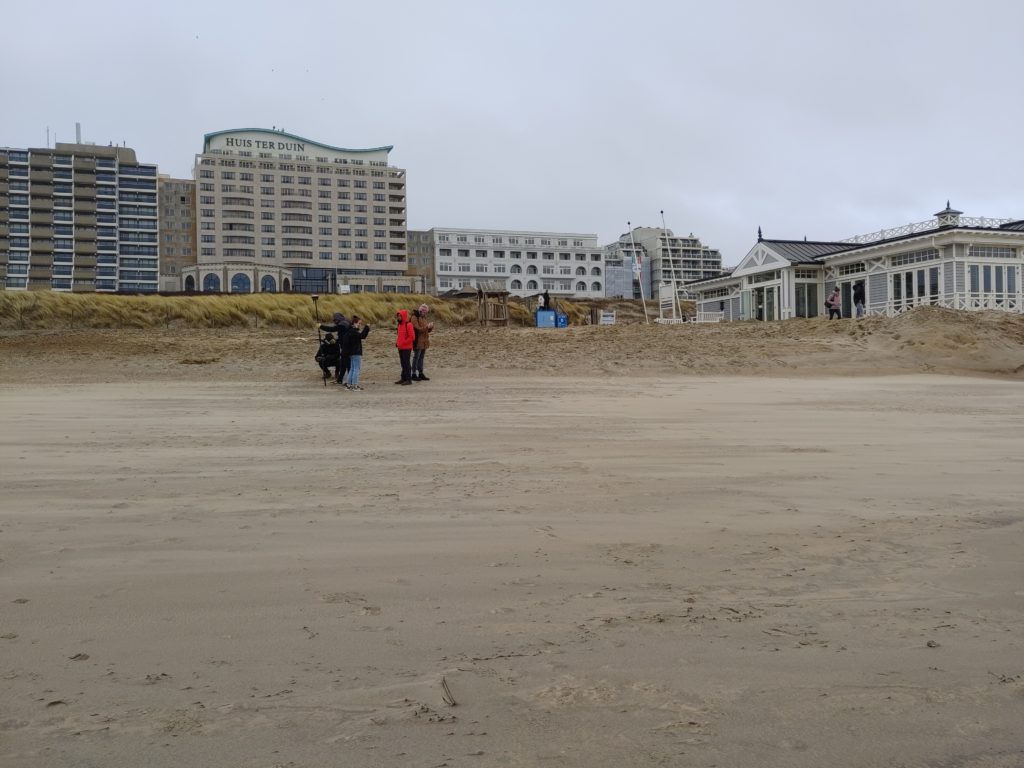
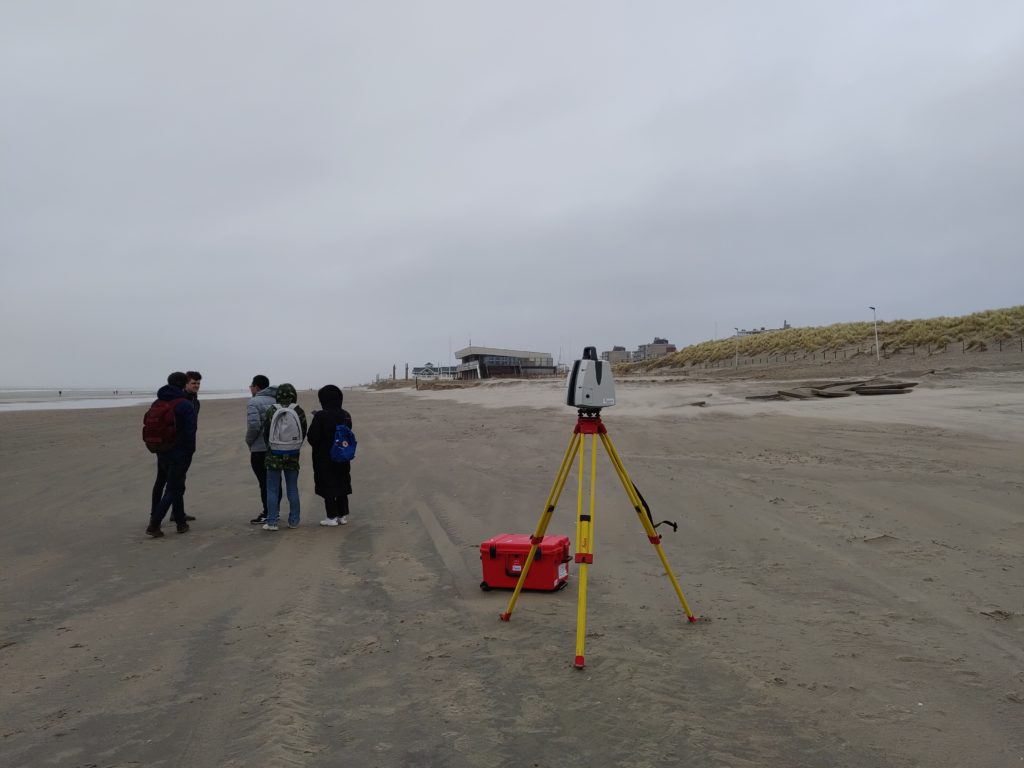
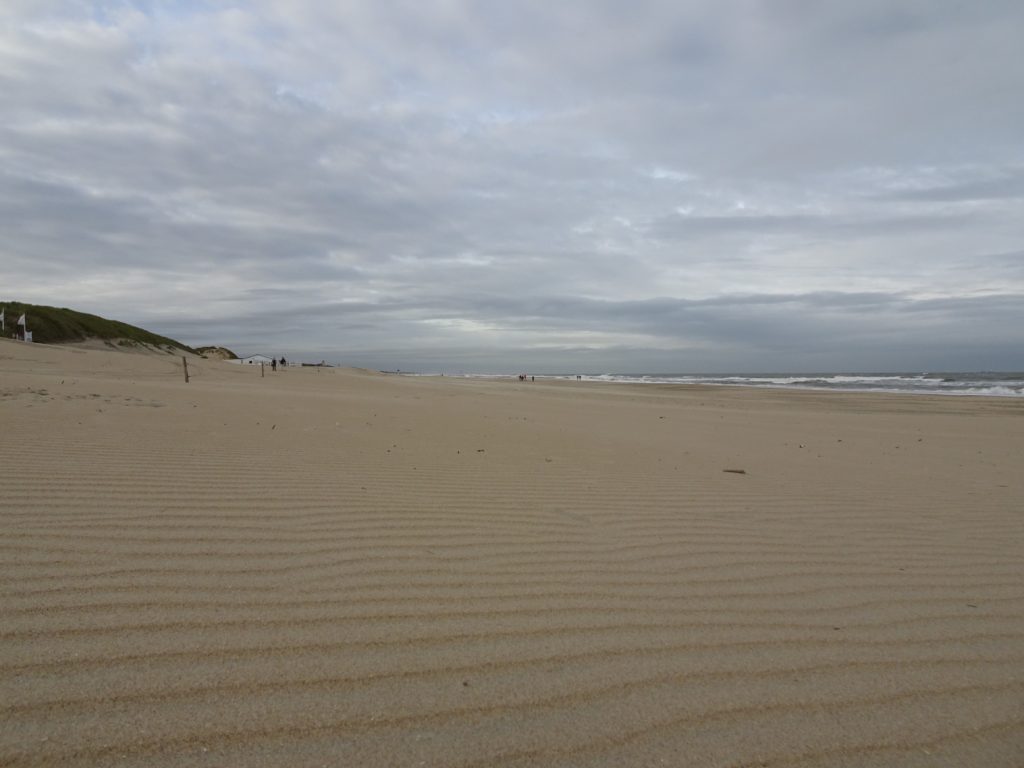
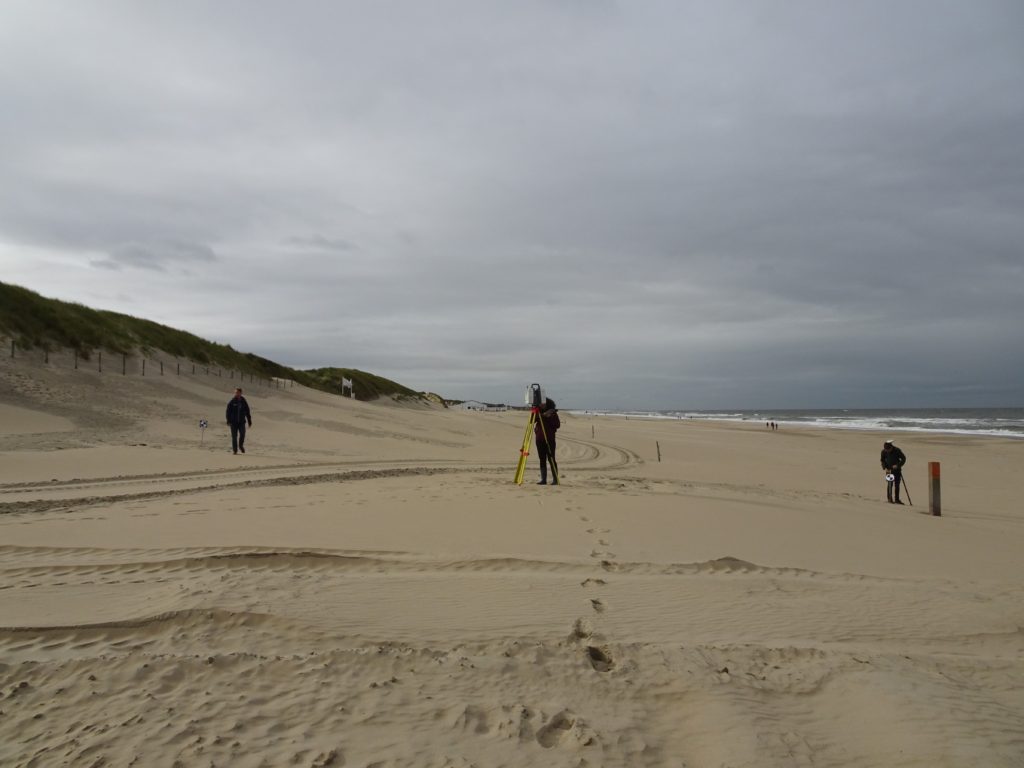
On 22 Feburary 2022 three groups of students went to the beach in Noordwijk to collect data for the course 3D-surveying of Civil and Offshore Infrastructure at TU Delft by R. Lindenbergh. The students study how to extract terrain at the beach and how sand-shapes appear from aeolian transport. Another group compares photogrammetry data and laser scanning data of the beach and dunes.

Lot’s of ‘flying sand’ called aeolian sand transport could be observed and will be studied with the help of the collected data.

Three storms in a row

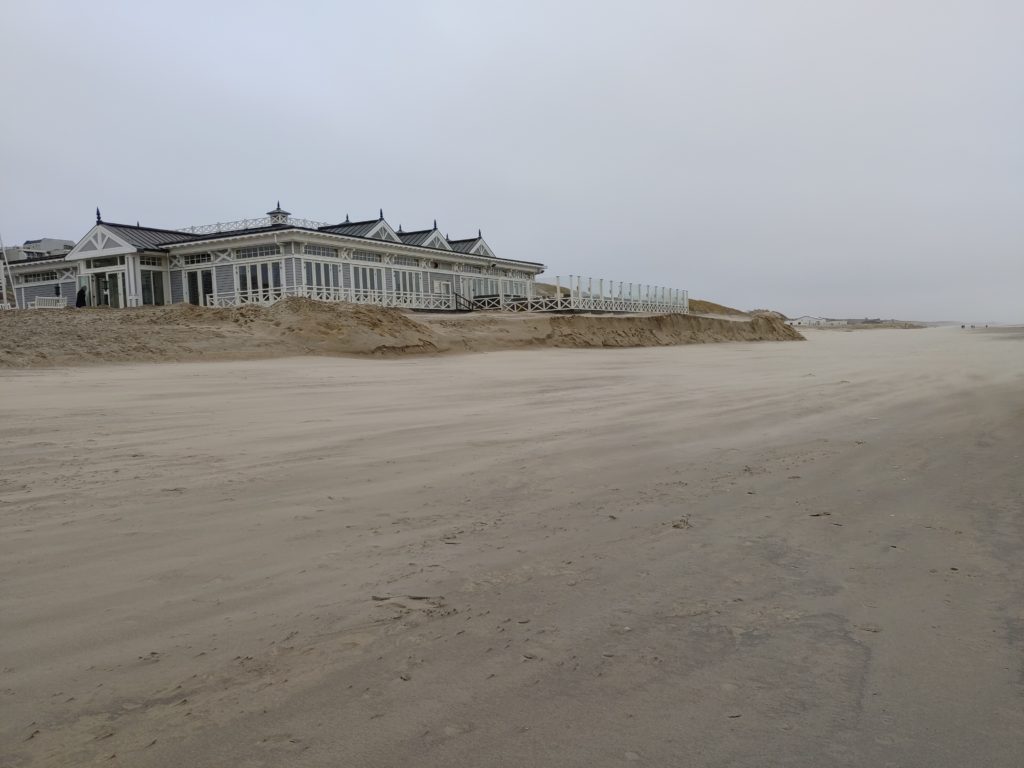
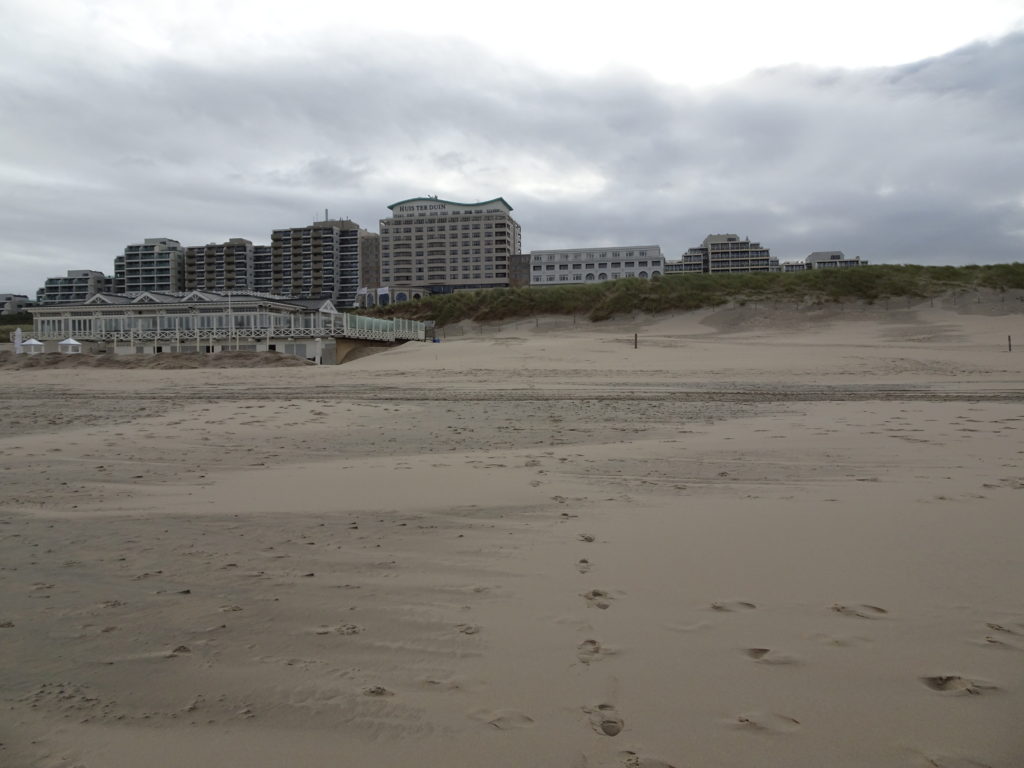
From 16 February to 21 February 2022 three storms hit the Netherlands within only five days. The storms named Dudley, Eunice and Franklin caused very strong wind with wind speeds above 20 m/s and the effects on the beach were still clearly visible one day later (22 February).

October 2021 additional scan

On 1st October 2021 we went with two students involved in the CoastScan project to perform our monthly scan from the beach. The dune foot is not captured by the permanent laser scanner in Noordwijk, so we regularly go to the beach to scan the dunes from the other side. K. Echeverry Caro works on filling these gaps in the data and quantifying the differences that they cause for her Bachelor thesis.

Helicopter scanned

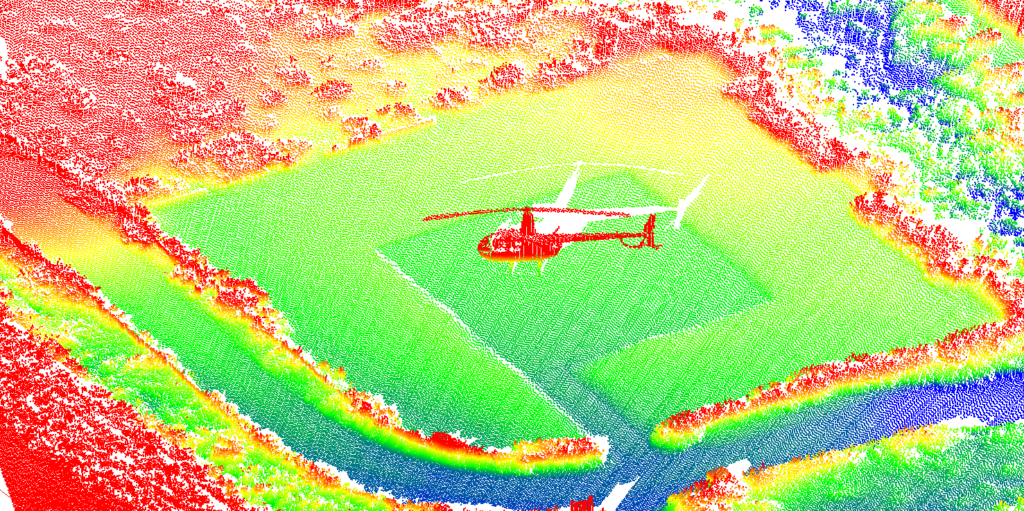
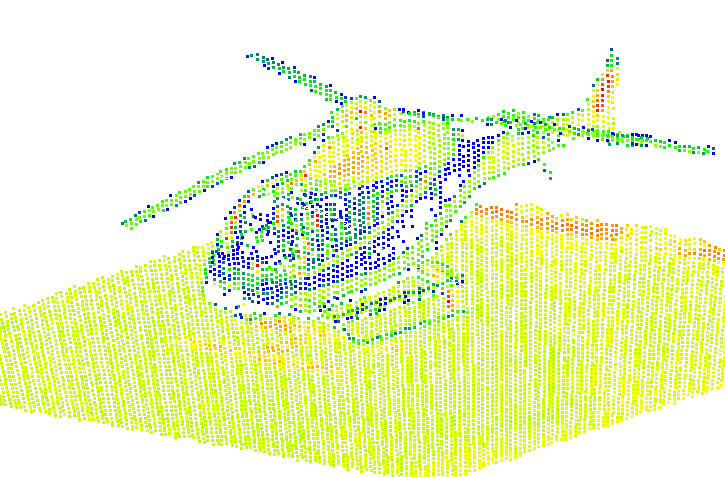
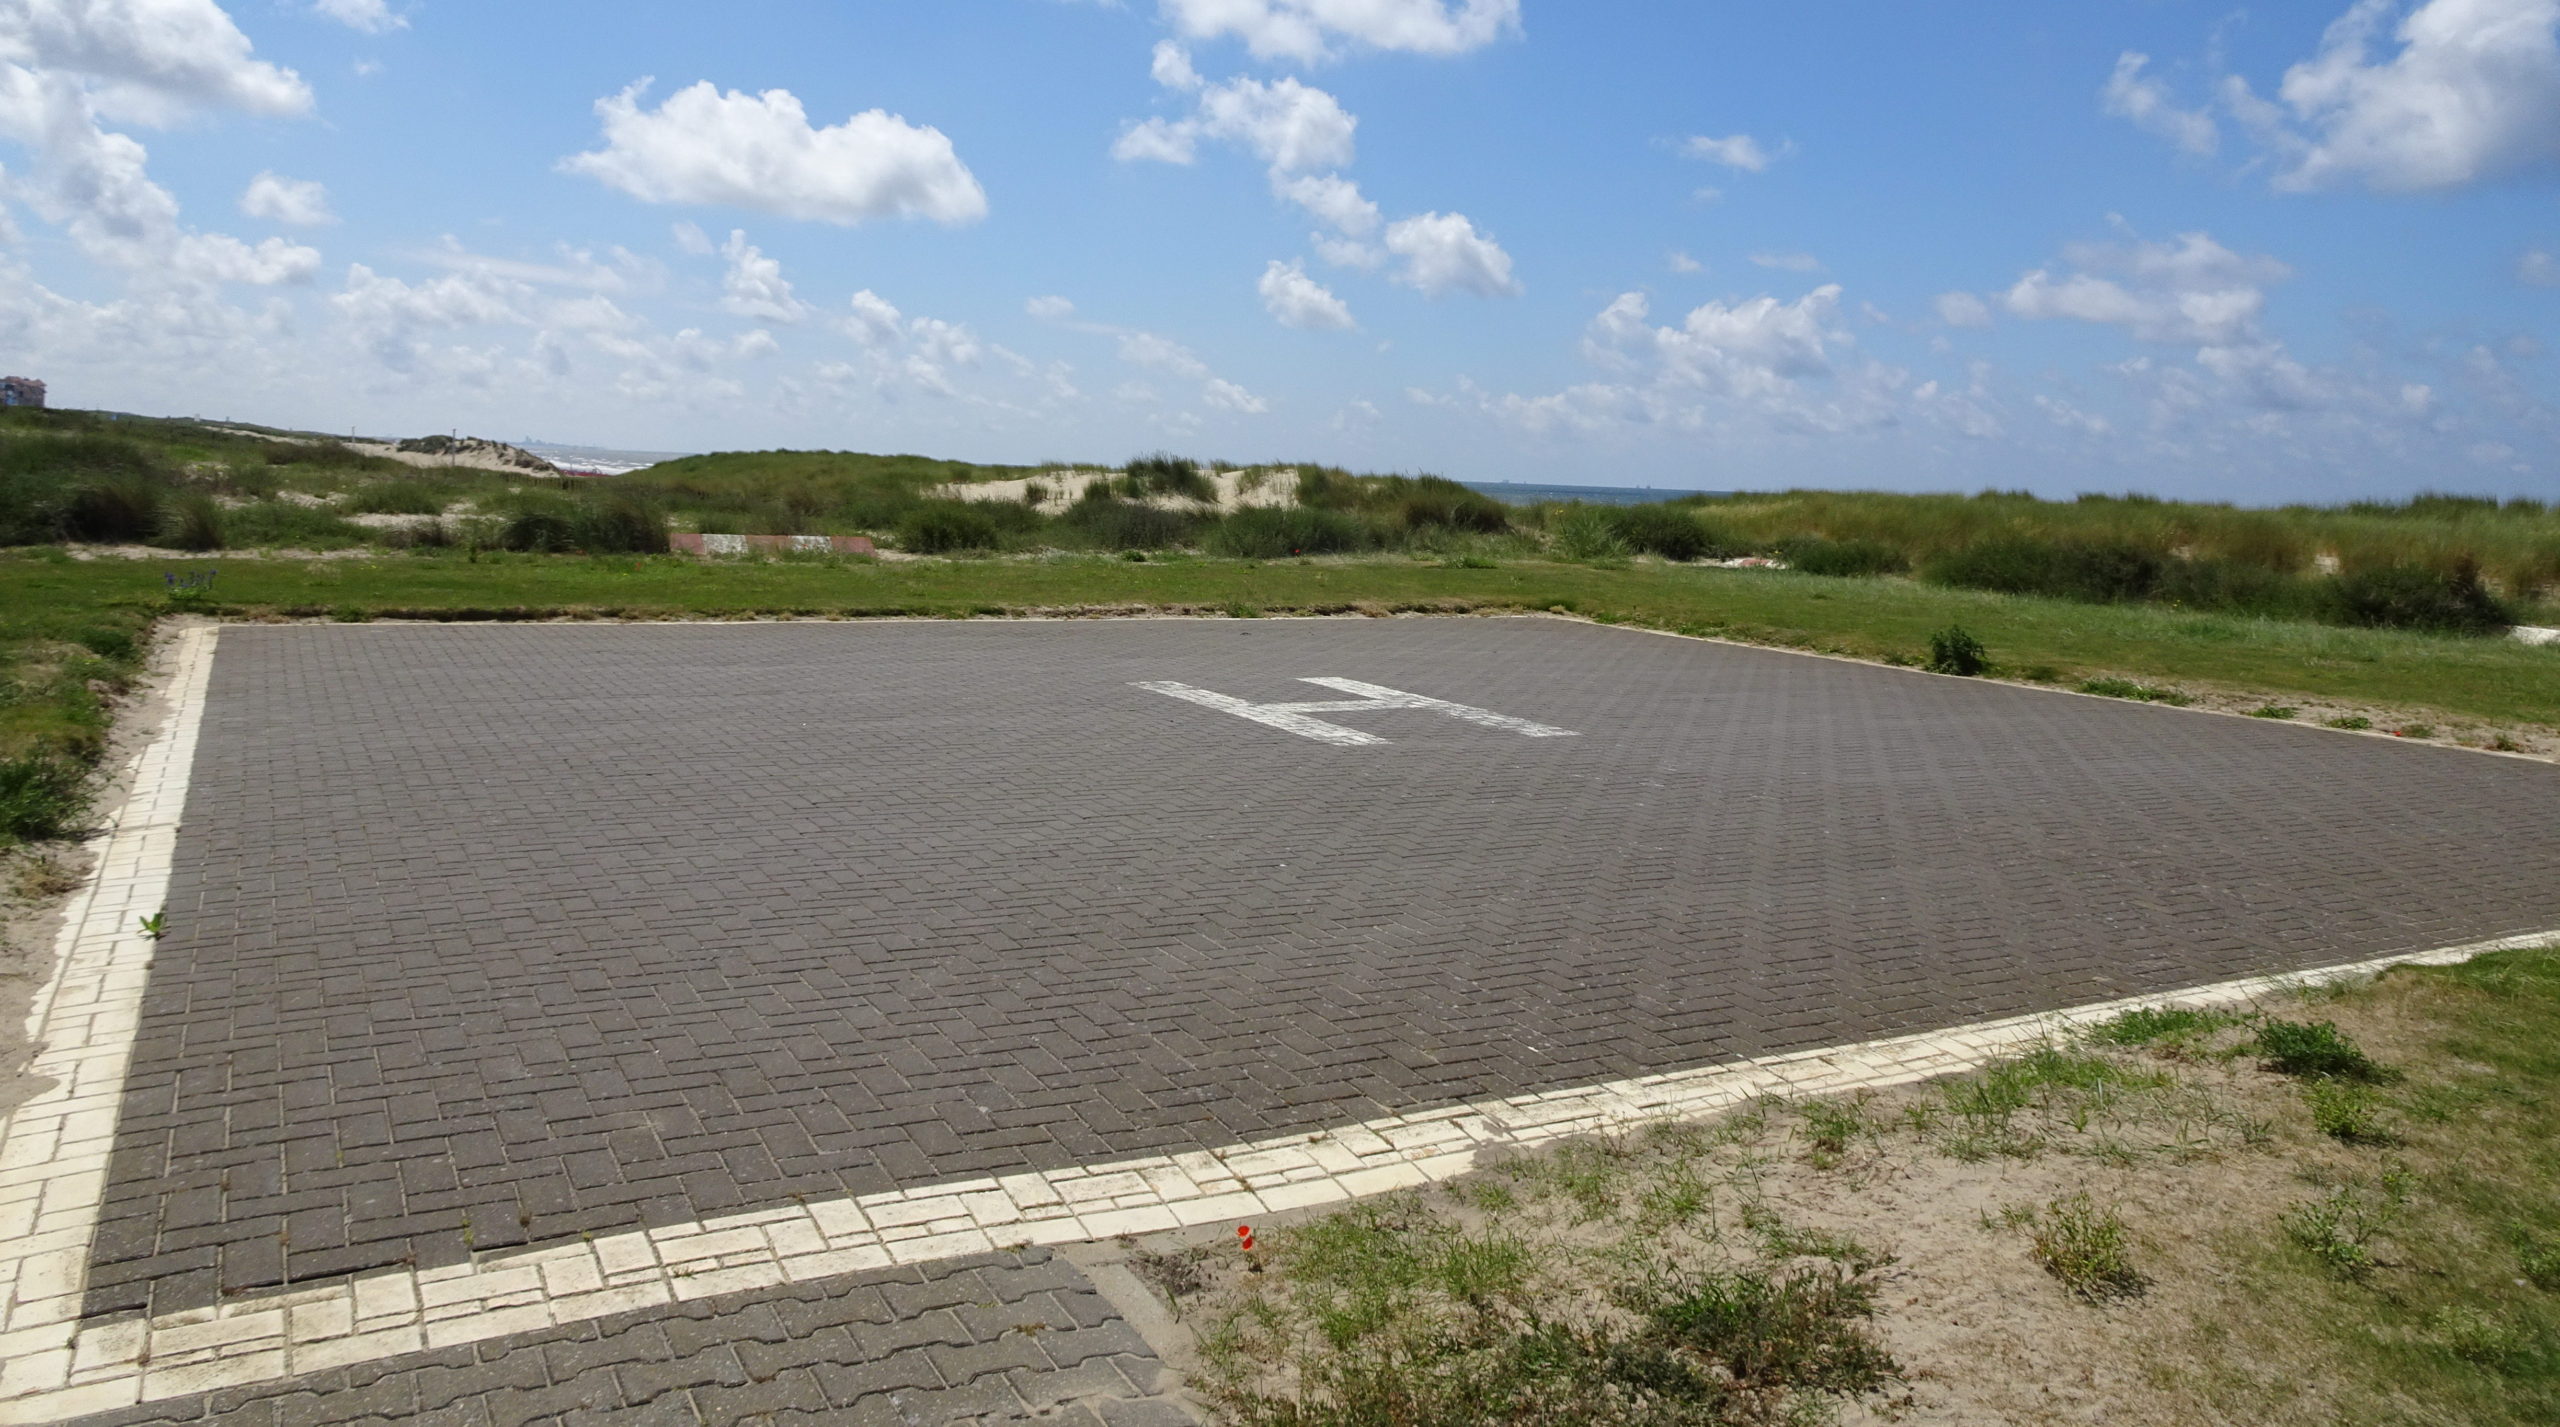
Part of the observed area in Noordwijk contains a helicopter platform in the dunes. Our research into data quality is making use of this platform as a reference surface (publication). During our research we found two helicopters that landed on the platform at two different occasions in September 2019 and in August 2020. Above the point clouds of the landed helicopters are shown colored according to elevation (left) and intensity (right).

Student project on counting people on the beach

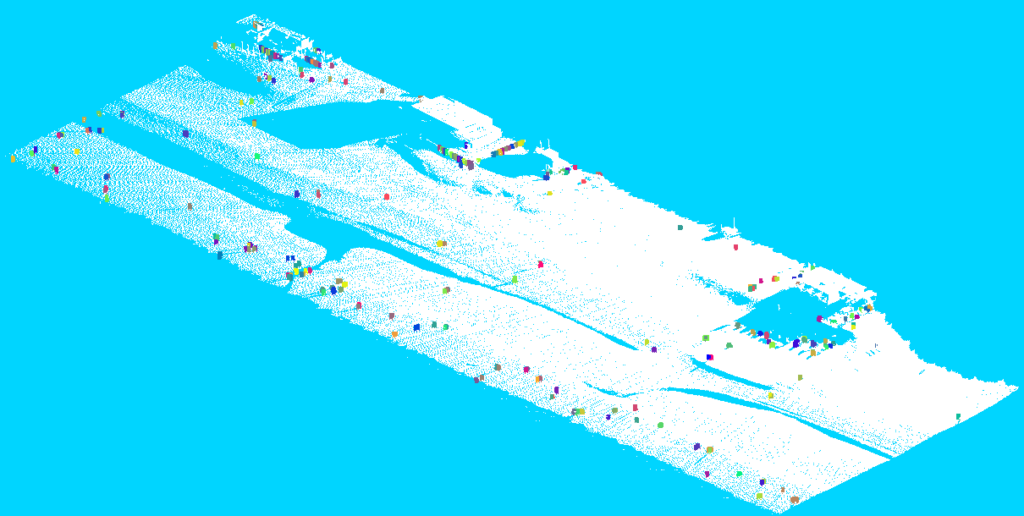
For the course 3D surveying of civil and offshore infrastructure at TU Delft a group of students has worked on counting the people that are walking on the beach using our CoastScan data from Noordwijk. In their final report they present their method that is able to detect up to 90% of the people that are walking on the beach in an area of about 400 m length in front of the laser scanner.

Point cloud of the beach in Noordwijk with people detected by the algorithm marked in colors.

Master Project deals with visualizations of CoastScan data

In February 2021 Y. Schreijer successfully completed her master thesis with the title: ‘Visual insight into the temporal changes of sand patterns along the Dutch coast’ under the supervision of E. Verbree and P. van Oosterom (TU Delft) and P. Goessen (Hoogheemraadschap Hollands Noorderkwartier). For her master project she used CoastScan data to visualize dynamics that influence deformation processes of the coast.

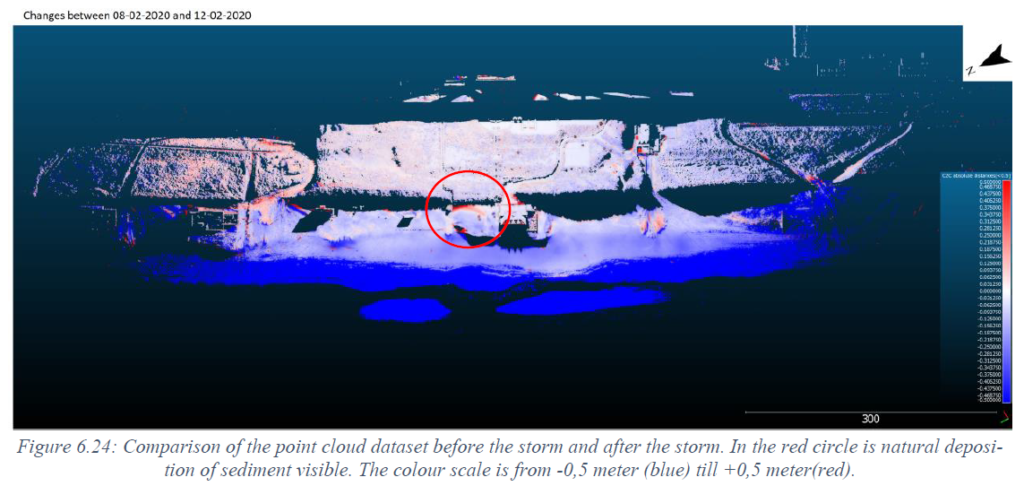
The image shows elevation differences in Noordwijk after a storm hit the coast in early February 2020. A large sand deposition is circled in red.

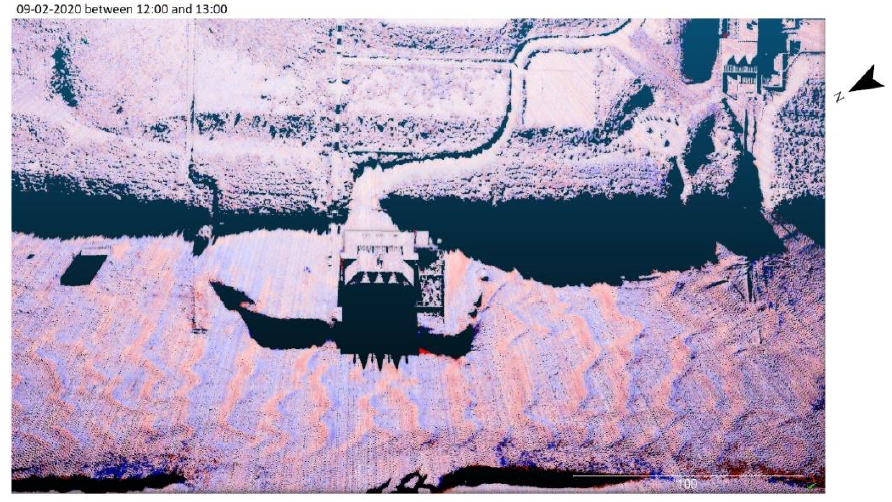
In a comparison between two consecutive scans (about one hour apart) moving sand ripples, possibly caused by aeolian sand transport due to strong winds, are made visible.